Lab 6: Network Monitoring and CRC
Objective
To gain experience monitoring network traffic on a host, and exploring the CRC checksum.
TShark Setup
Wireshark is a popular packet sniffer/analyzer. We will be using the terminal version of this program which is called TShark. First you need to install the tshark package on your virtual machine. It will ask you if you want to allow non-root users to be able to capture packets on the system. You should answer yes to this question.
The wireshark group is used to limit who onn a system is
allowed to monitor packets, so you will need to add your user to this
group. Then, logout of the machine and log back in for this to take effect.
If you get the following error message:
Capturing on 'Cisco remote capture: ciscodump'
tshark: Couldn't run dumpcap in child process: Permission denied
0 packets captured
Then you did not setup the group properly.
Using TShark
When you run the command tshark command, it will print all of the
packets being processed by the machine. Below is an example:
$ tshark
Capturing on 'ens4'
    1 0.000000000   10.142.0.3 → 173.71.207.247 SSH 102 Server: Encrypted packet (len=36)
    2 0.013974434 173.71.207.247 → 10.142.0.3   TCP 66 44260 → 22 [ACK] Seq=1 Ack=1 Win=323 Len=0 TSval=913110574 TSecr=3780862521
    3 0.014002333 173.71.207.247 → 10.142.0.3   TCP 66 44260 → 22 [ACK] Seq=1 Ack=37 Win=323 Len=0 TSval=913110575 TSecr=3780862523
    4 0.023856025 173.71.207.247 → 10.142.0.3   TCP 78 [TCP Dup ACK 3#1] 44260 → 22 [ACK] Seq=1 Ack=37 Win=323 Len=0 TSval=913110581 TSecr=3780862608 SLE=1 SRE=37
    5 0.431006150   10.142.0.3 → 173.71.207.247 SSH 198 Server: Encrypted packet (len=132)
    6 0.431048991   10.142.0.3 → 173.71.207.247 SSH 102 Server: Encrypted packet (len=36)
    7 0.431140897   10.142.0.3 → 173.71.207.247 SSH 238 Server: Encrypted packet (len=172)
You will need to type Ctrl-C to stop tshark when you are done. The columns displayed by default are:
- An index number which just starts at 1 and increments.
- The number of seconds since tshark was started that the packet was processed.
- The source and destination address of the packets. The source is on the left and the destination on the right. Here 10.142.0.3 is the internal IP address of my VM, and 173.71.207.247 is the external IP of the wireless router I was connected from. The only traffic at this point is between these two machines.
- The protocol. Here there are two protocols, SSH and TCP.
- The number of bytes in the packet.
- Information about what's in the packet. SSH packets are encrypted, so tshark just says that. The "ACK" packets stand for "acknowledgement". Part of the TCP protocol is that when packets are received, a small "ACK" packet is sent back to the sender so it knows it went through. SSH is an application layer protocol built on top of TCP, which is at the transport layer. Those ACKs are my machine sending the VM acknowledgement that it received SSH packets.
Instead of tshark running indefinitely, we can tell it to read some number of packets and stop with the -c flag (which stands for count):
$ tshark -c 10
We can also have tshark dump the data into a file rather than directly to the screen with the -w flag (which stands for write):
$ tshark -c 10 -w traffic.pcap
This way the data can be stored for later analysis or backup. The .pcap extension stands for "packet capture" and is a standard format for information on network packets. It is not a human-readable format, but stores all the information tshark can get from the packets including the actual contents.
To have tshark print its information on a .pcap file, we can give it the -r flag, which stands for read:
$ tshark -r traffic.pcap
We can also tell TShark to only show us traffic that we are interested in, such as only from a specific host, or on a specific port. HTTP uses port 80, so if we want to see only HTTP traffic, we can do it like so:
$ tshark -f "port 80"
Now only packets for the HTTP server will be displayed instead of all traffic.
Part 1: Network Traffic
For this part, use tshark to answer the following questions about HTTP traffic on your VM:
- Run TShark to monitor port 80, and then open up your VM's web site in a browser (or refresh it if you already have it open). How many packets are sent in total between the two machines to do this?
- How much time does it take to complete the process?
- How many of these packets are from the VM to your browser, and how many from the browser to the VM?
- One of the packets from your browser to the VM is different than the others. What do you think it's doing?
- Why are the smallest packets all the same size? What do they contain?
- Which of these packets has the greatest size? What data do you think that packet contains?
- Do this experiment again, but now instead of just putting your VM's IP address into the URL bar of your browser, append "/missing.html" instead. The browser should show a "Not Found" message. What is different in the packets that are produced by doing this?
Part 2: Ethernet Frame Details
TShark can display some of the fields in an Ethernet frame for us. Recall that Ethernet frames look like this:
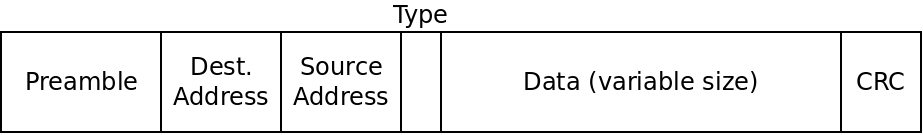
The first thing we will investigate is the address fields. Recall that the address here refers to the hardware address of your network interface, i.e. the MAC address.
By default, TShark does not print MAC addresses. To get it to, we can pass the following flags to TShark:
tshark -T fields -e eth.src -e eth.dst
This will cause TShark to print the source and destination MAC address of the packets it sees.
The type field in the Ethernet frame diagram above is always
included in the frames. One function it has is to distinguish between
IPv4 and IPv6. For IPv4, the type field is equal to 0x800.
For IPv6, it should be 0x86dd
To get TShark to show us the type field, we can run:
tshark -T fields -e eth.type
- What is the MAC address of your VM's network interface?
- If you run TShark to capture 100 packets, how many are to your VM and how many are from it?
- How many other nodes is your VM communicating with? Explain why that number makes sense.
- In those same 100 packets, do they use IPv4, IPv6, or a mix of both?
Part 3: CRC
We can look for packets with a bad checksum by passing the "eth.fcs_bad" field:
tshark -T fields -e eth.fcs_bad
If there are any frames with a bad checksum, they should print something out. Frames with a correct checksum will print nothing.
We can also compute CRC32 checksums for any data we want to. To do so,
first install the package libarchive-zip-perl. We can then
use the crc32 command to compute checksums of files:
$ echo "Hello" > file.txt
$ crc32 file.txt
363a3020
This prints the 4 byte checksum as 8 hexadecimal digits.
- If you tell TShark to scan 1000 frames, do you receive any with a bad checksum?
- Download the file at sample.txt. What is the checksum value for this file? Now change the b in "robust" to a "c". This will make 1 bit of change to the input. Re-compute the checksum. Is it a little different or completely different?
- Compute the checksums for the files file1.txt and file2.txt. What are the checksums for these two files? Do they have the same contents? What does this mean?
Submitting
Submit the answers to the questions in the assignment in Canvas.